Influencing Factors in Online Traffic
This analysis used Excel, and Python, with Tableau Public for the final presentation. To follow along in greater detail please click the links below.
Problem and Background
A commercial website specializing in boats is seeking to understand the behavior of people who visit their site from week to week. They also want to understand which boats are more popular and what are the potential factors to influence increased views.
Needs
Identify all factors that could influence boat popularity.
Understand where the majority of traffic is coming from and why.
Data Collection, Cleaning, and Transformation
Data Collection
This is an open source dataset available on kaggle.com. It contains a week's worth of data, representing a single week for the boat company. While it represents the potential information that would be sent in weekly updates it was last updated over two years ago.
Integrity, Quality, and Consistency
Original data was recorded for consistency and checked for unusual values, missing entries, and typographical inconsistencies, and new totals recorded and compared to the original. All changes going forward were also logged at every stage.
Data Transformation
During this phase the encoding issue found in the geographical data was addressed. Many of the regional names contained diacritics that excel and python were unable to read or sort through. I determined that all I needed was the country name of each entry, and went about decoding and transposing the information into a new column. I then unified the different currencies by creating a single price column in euros and converted other currencies into the new column. Other changes included organizing propulsion, fuel, and material type.
Analysis Highlights
Exploratory Analysis and Forming a Hypothesis
This project was self-driven, and during the cleaning process I began to develop a list of questions to guide my analysis as well as forming a hypothesis. To determine what is driving views I began by looking at individual variables to aid the formation of a hypothesis. Price stood out as a possible driving cause for views. Price could be either an incentive or deterrent depending on the type of customer visiting the site, and without knowing what the makeup of customers I went with what would deter myself from looking at a boat.
Hypothesis: As price increases views decrease.
Testing the Hypothesis and Clustering
One of the ways I tested for individual variable correlation was by creating a heatmap in python. This type of chart looks at only numerical variables. The closer the number is to 1.0 the more positively correlated the variables are to each other. Price and number of views have a negative number, which confirms that as price increases the number of views decrease.
This was a start, but a more multivariated analysis was needed to pinpoint which boats draw more views and why.
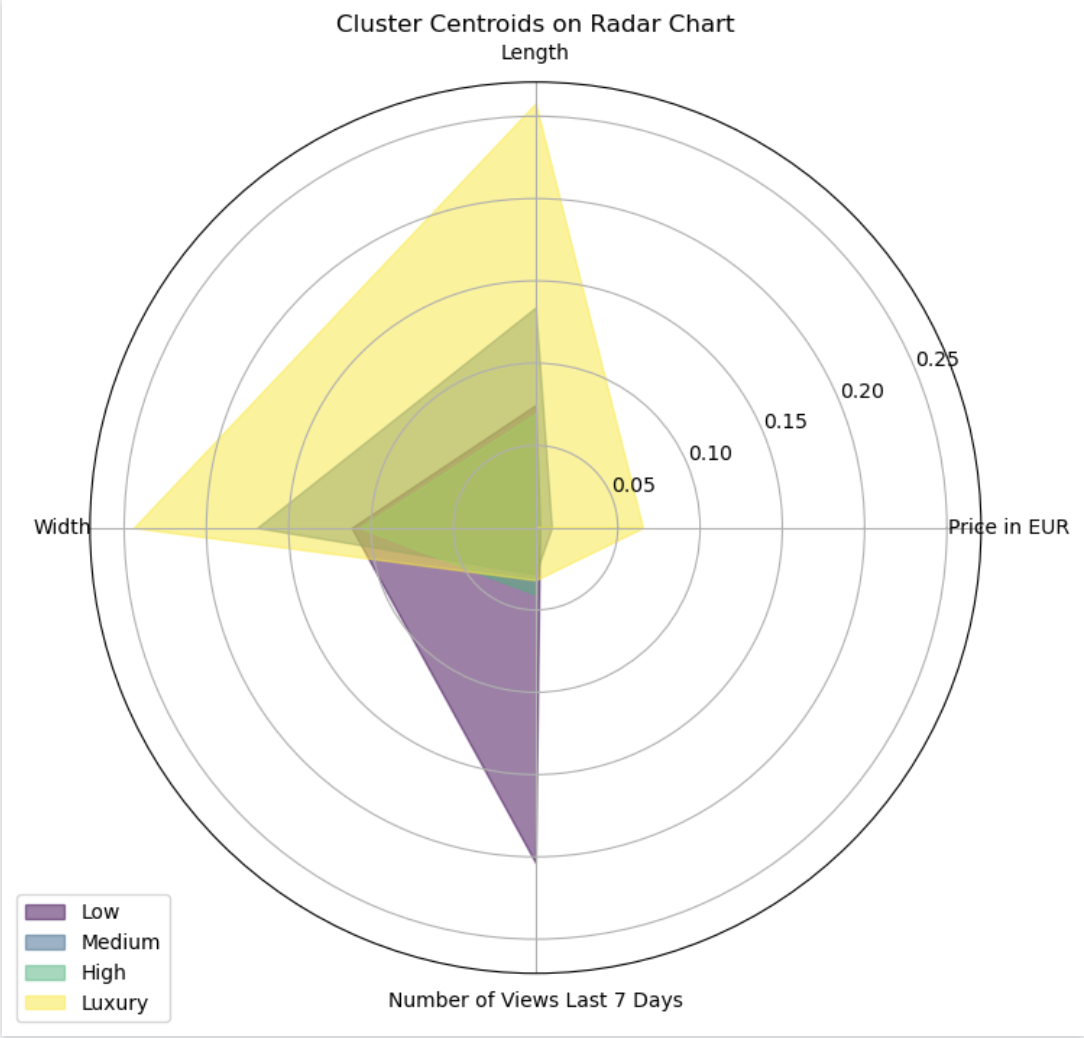
Following the results of the hypothesis testing I used cluster analysis to learn more about the composition of boats viewed in the last week. This type of analysis also focuses on numerical variables, and four groups emerged.
Low
95% of total boats viewed
Total count: 8,780 boats
Price range: 3,300 - 1,034,368 euros
Medium
4% of total boats viewed
Total count: 382 boats
Price range: 1,040,000 - 4,425,287 euros
High
0.7% of total boats viewed
Total count: 64 boats
Price range: 4,500,000 - 12,150,000 euros
Luxury
0.087% of total boats viewed
Total count: 8 boats
Price range: 14,850,000 - 31,000,000 euros
Creating a Profile
After examining the numerical values I began to build a profile of what characteristics aligned with highly viewed boats. These individual profiles will offer insights into how upcoming boats may perform in the future.
I created charts for the Tableau presentation to show each breakdown by country which will aid the marketing team with any focused approach they may decide to take with this information.
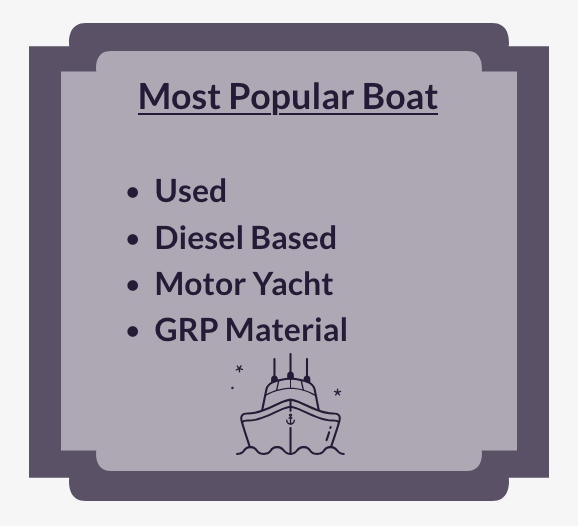
While many boats fell under multiple labels within a category, it became apparent that the most popular type of boat is a used motor yacht that uses diesel and is made from glass reinforced plastic (GRP).
Conclusion and Next Steps
Conclusion
Understanding what draws people to view certain boats over others is not as simple as finding a single factor. It is important to look at all the data available in order to create a well-rounded foundation for future incoming data. Through examining each variable a picture began to form of which boats were favored and which were not.
In one week people from 46 countries visited the website. Three countries, Switzerland, Germany, and Italy, accounted for over 60% of total views with Switzerland holding the most at just under 24%. As this is only a single week's worth of data we cannot say yet whether these numbers will remain consistent or if it is an emerging trend.
A hypothesis was formed around the idea of price being an important factor to potential customers, and through testing the correlation between price and views it was confirmed that as the price of a boat increases the amount of views garnered decreases. Through cluster analysis the lower priced boats emerged as the largest group viewed on the website.
Visitors from each country favored a variety of boat types, but a single type emerged as the overall popular profile, but it is interesting to note that this aligned with only one of the top three countries, Germany. Italy and Switzerland differed slightly, and this would be interesting in examining continuing data to see if these profiles remained consistent.
This project was completed with a data dashboard created on Tableau, with a mixture of charts created with Tableau Public and python coding. Detailed reports and documentation of each step were also compiled during this analysis and attached to the project deliverables.
Next Steps
Limitations: There are some unknowns when it comes to this dataset that put some of the questions raised into unobtainable loose ends. For one, there is no sales data that could shed light into how viewership on the website translated into customer action. If this project were to continue there is a list of questions about the dataset that would need to be brought to the attention of the project manager in order to be addressed.
For continuing this project with new data, first some of the vagueness in the data needs to be addressed with the project manager. If possible, sales data, geographic data on the boats, and time from viewing to purchase would be requested to deepen the understanding of online factors.


